

The UK Housing Shortage Isn't a Policy Problem, It's a Structural One. Here’s What That Means For You.
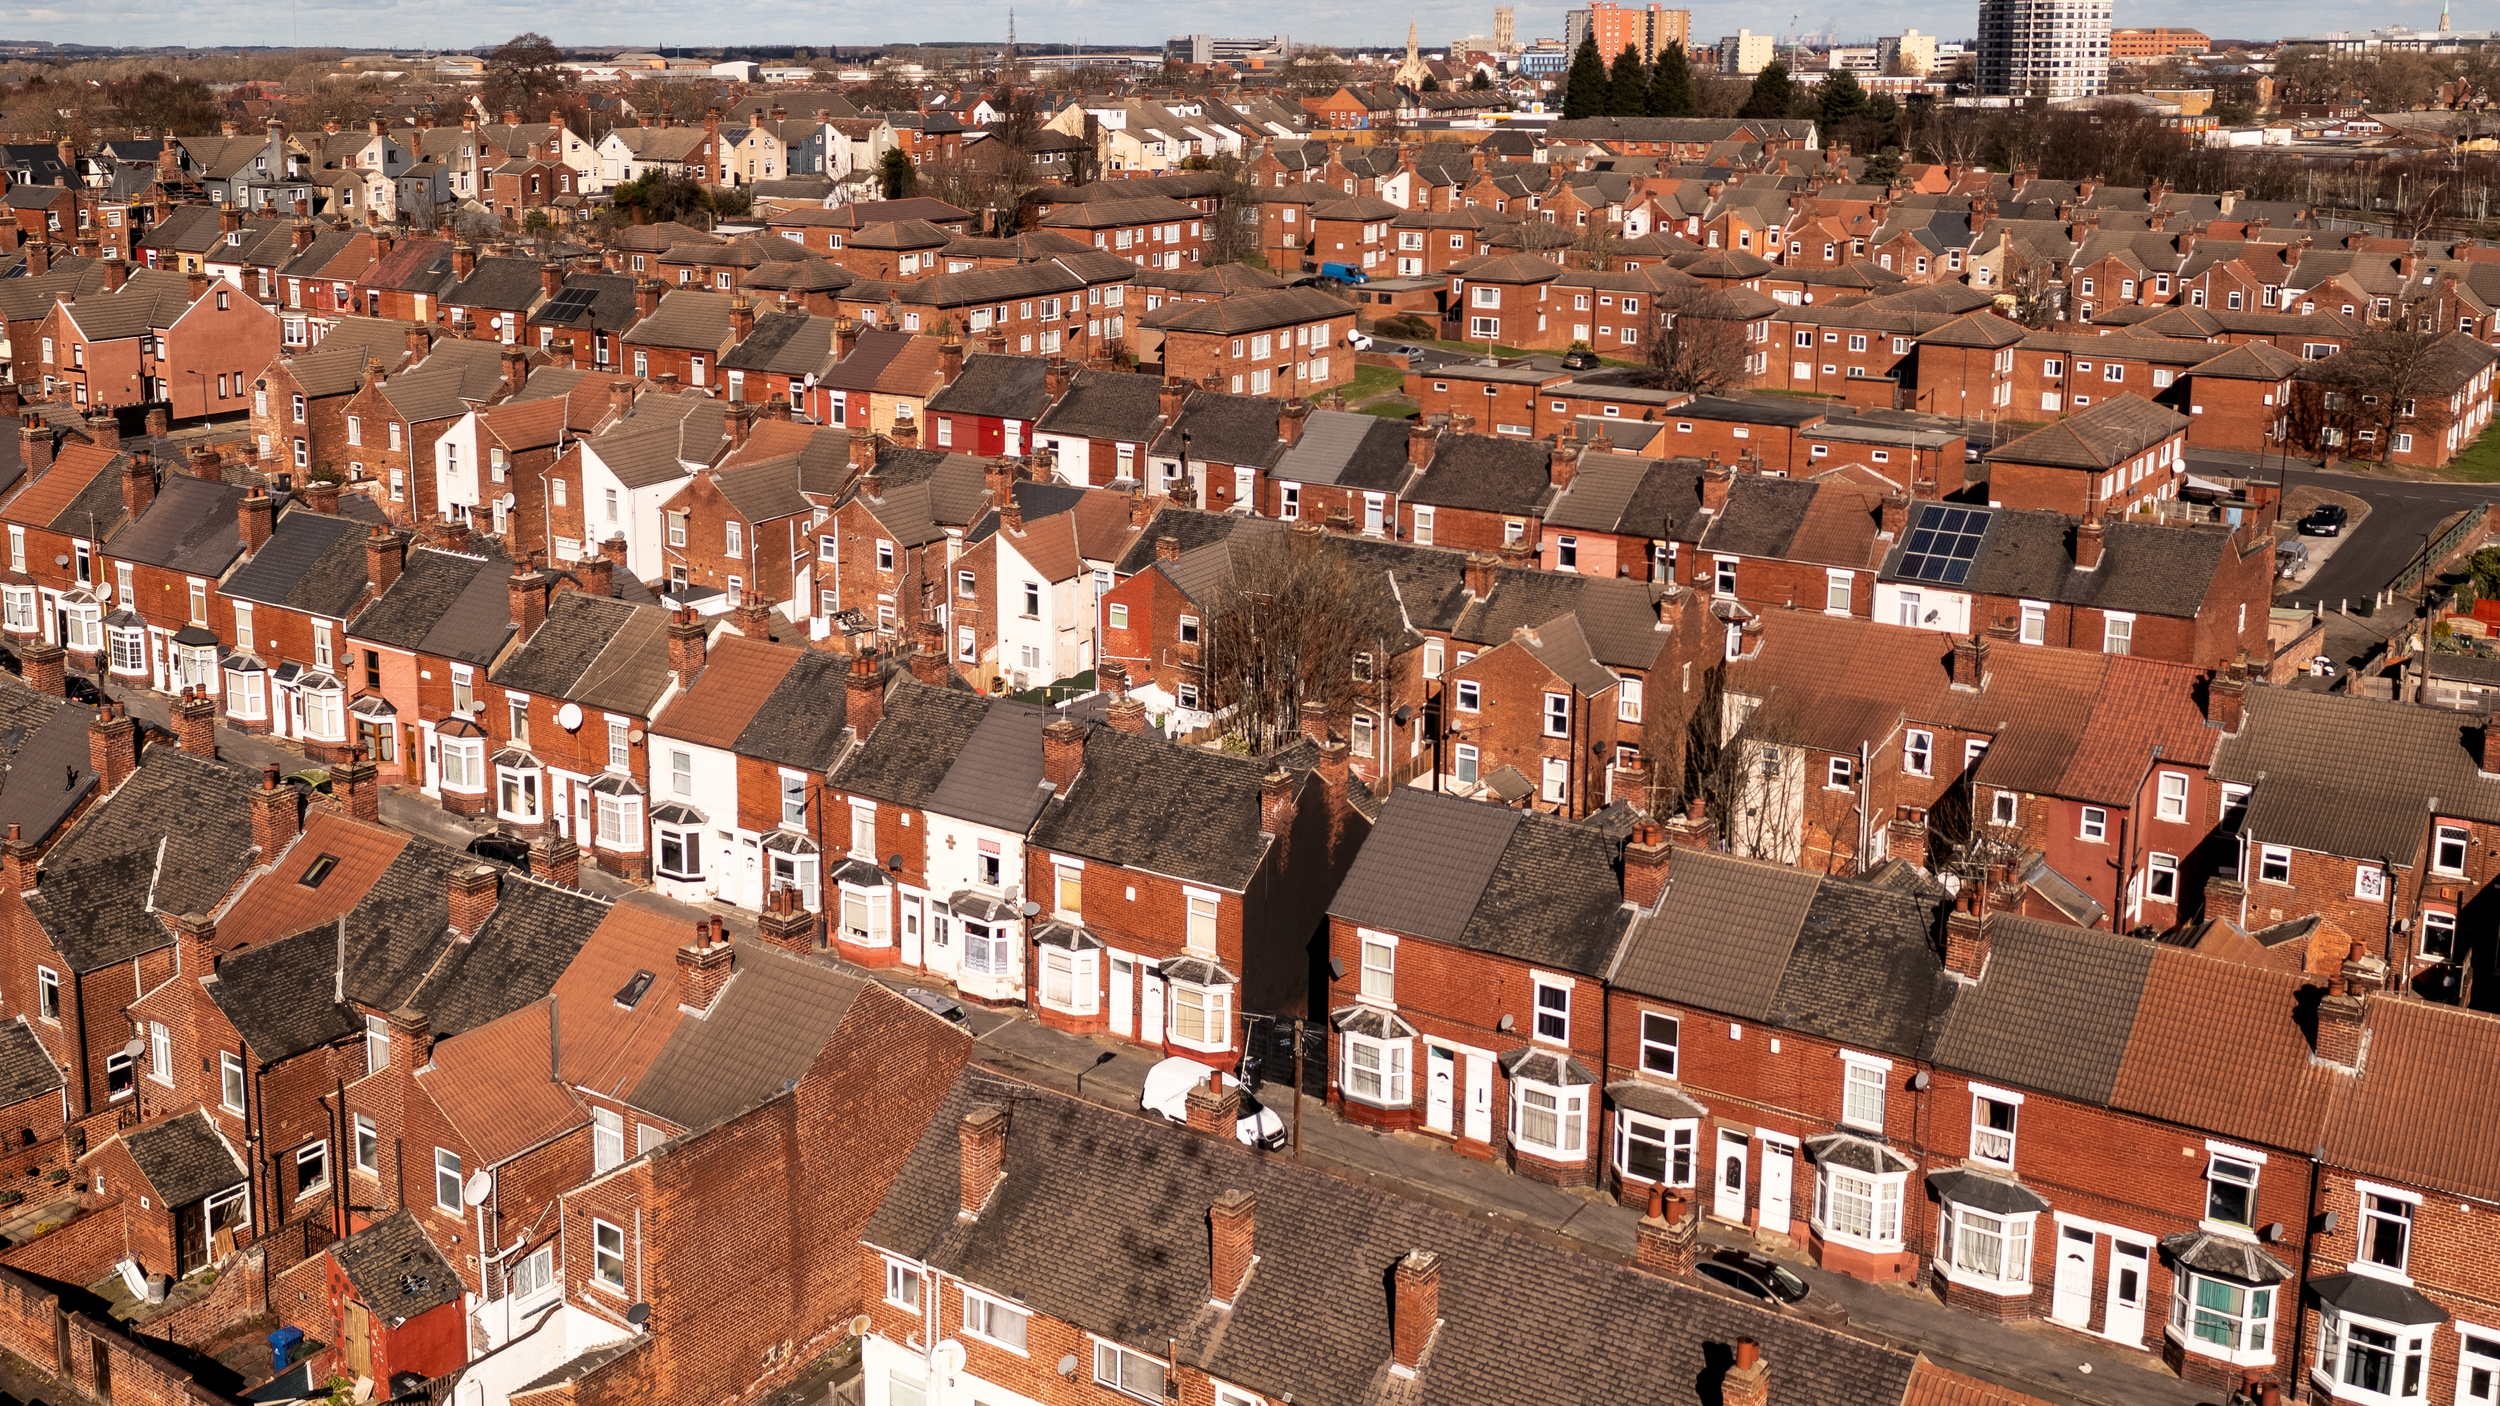
The latest forecast from Savills Research puts England on course to average just 167,500 new homes a year through 2029/30 – barely 56% of Labour's 300,000-per-year target. But this Savills data is only the latest in a long line of evidence pointing in the same direction.
This isn't new. Every few years, a new government announces a bold housing target. Every few years, the numbers fall short. What's striking isn't the ambition – it's how reliably the gap between promise and delivery stays wide, regardless of who is in power or what policies they introduce. When you stack that figure against data from the government's own housing department, the British Property Federation, RICS, and independent urban economists, a consistent story emerges: this is a structural feature of the UK market that has been building for decades.
The Scale Is Bigger Than Most People Realise
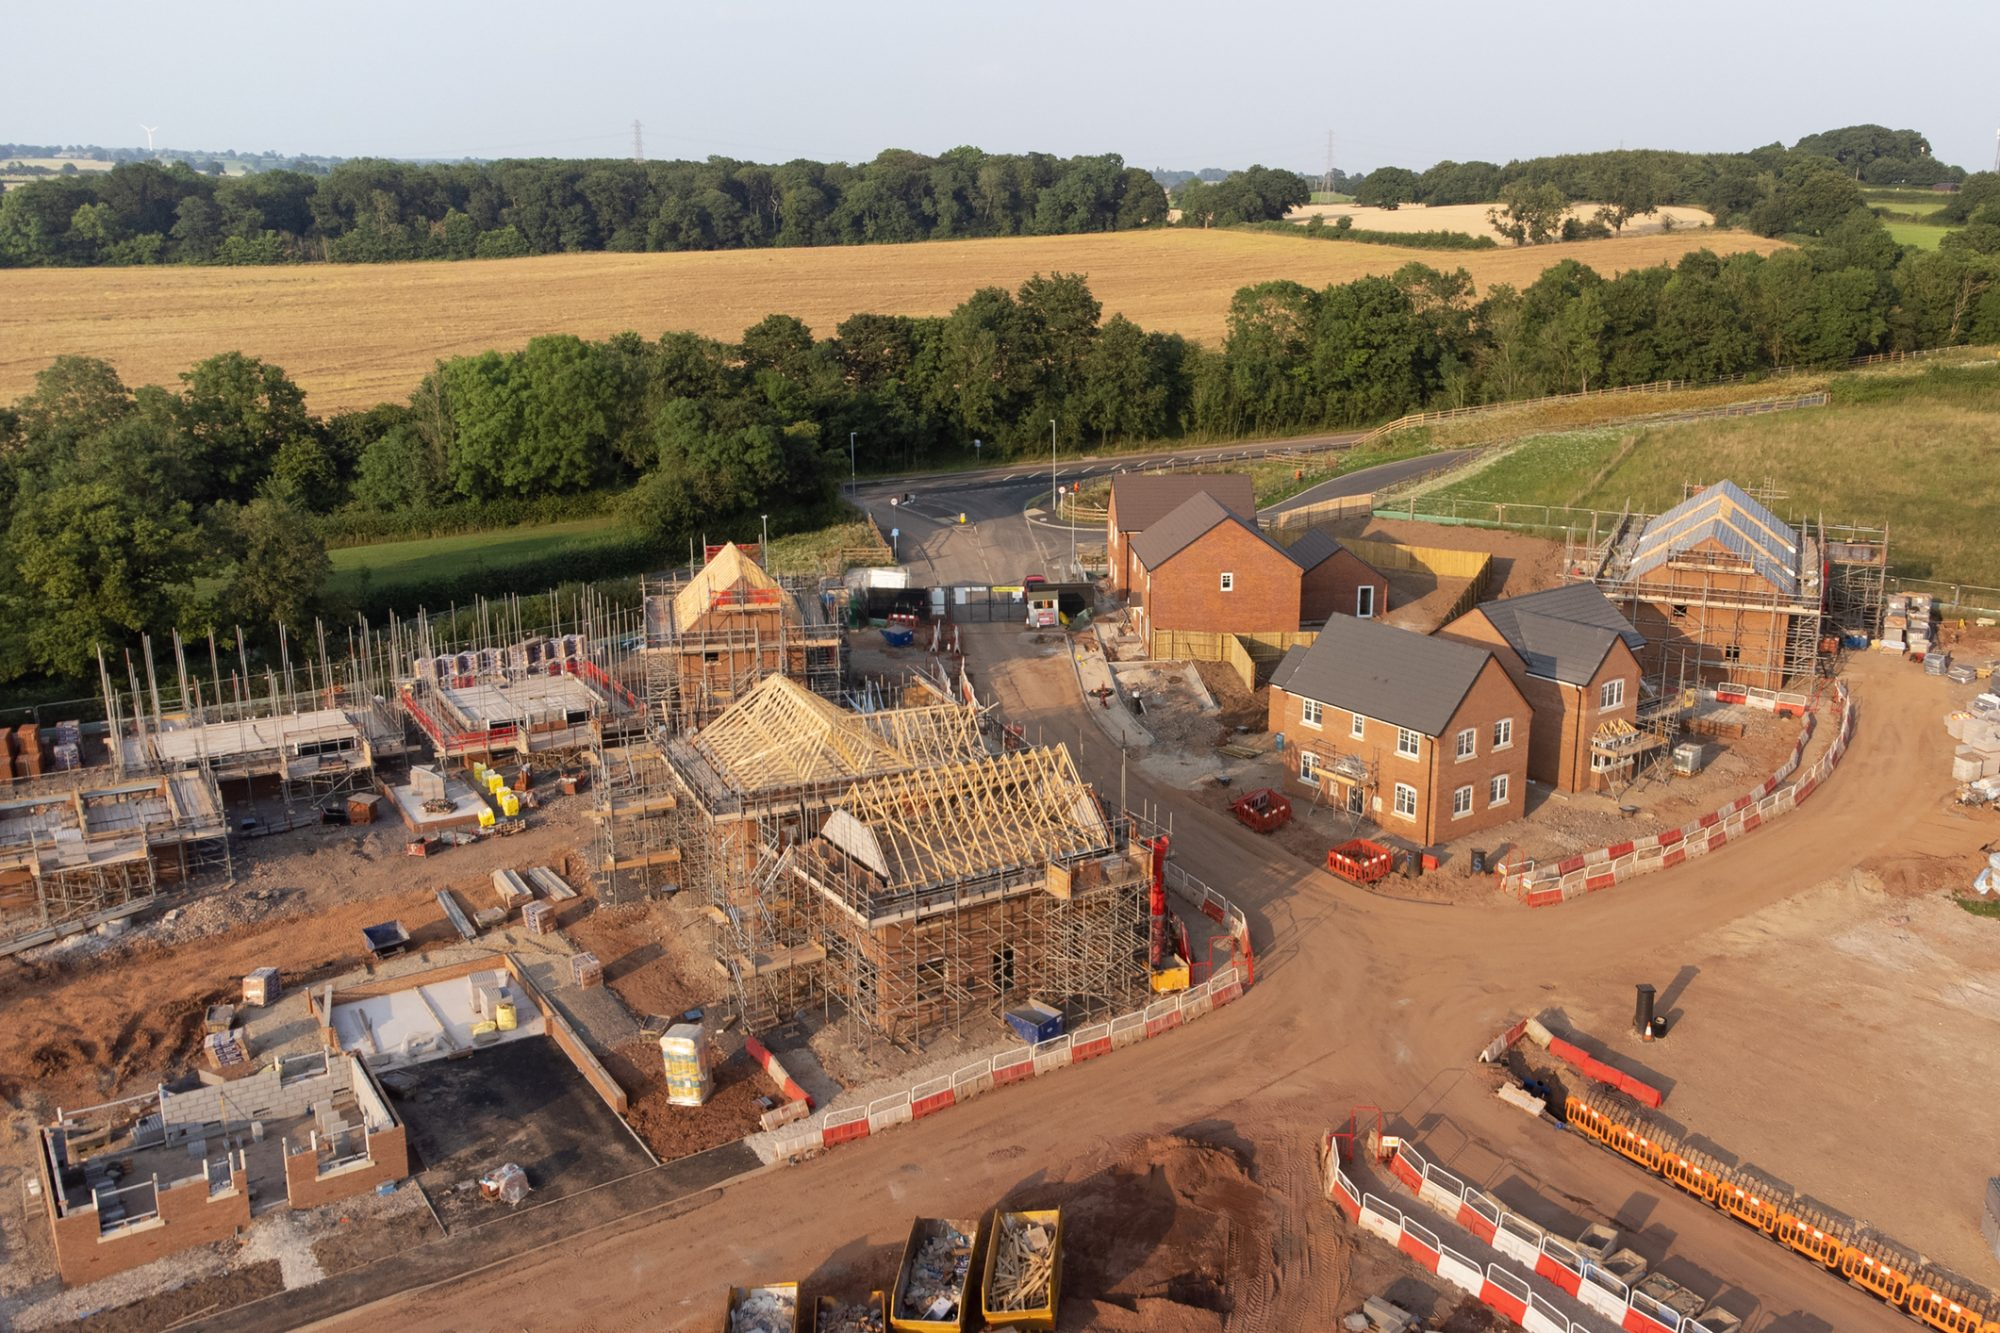
The Centre for Cities puts it plainly: compared to the European average, Britain has a backlog of 4.3 million homes that were simply never built. Even if the government's 300,000-a-year target were hit in full – which no credible forecast believes it will be – it would take more than half a century to clear that backlog.
That's a generational deficit.
The most recent government data makes the current trajectory clear. MHCLG figures show net additions to England's housing stock fell 6% in 2024-25 alone, to 208,600 – now 16% below the 2019-20 peak of 248,590. According to the Building Cost Information Service, England's completions in 2025 fell to their lowest level since 2016 – and sit more than 20% below pre-pandemic levels. The problem isn't improving. It's deepening.
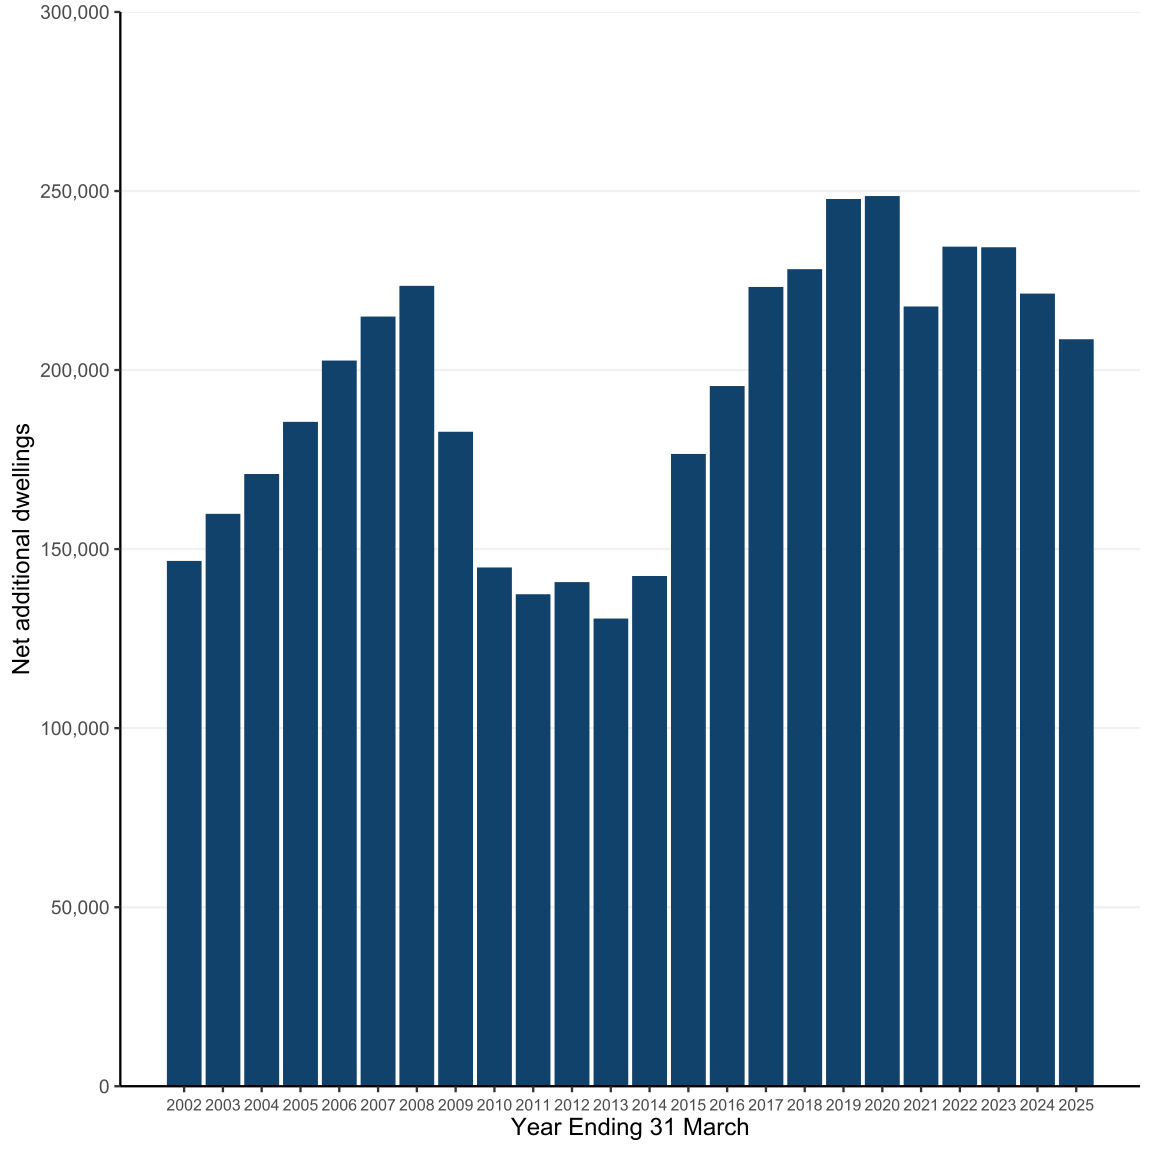
Source: MHCLG – Figure 1. Trends in net additional dwellings, England, 2001-02 to 2024-25
"What's telling is that the 300,000-home target isn't new – it's been the stated ambition of multiple governments for years, and it's never been met. Each year of underdelivery compounds the imbalance. The shortfall doesn't get built retrospectively. It simply accumulates, which is why what we're dealing with now isn't a temporary dip in supply – it's a chronic structural gap."
— Siôn Bennett, Director and Co-Founder of On Invest
The Market Is Caught in a Viability Trap
Here is the part that most market commentary skips past: developers cannot simply build their way out of this, because in many cases the economics won't let them. Build costs have risen significantly faster than house prices over the past four years, which means an increasing number of schemes that looked viable two or three years ago no longer do. Fewer sites get financed, fewer break ground, and the completions data reflects that.
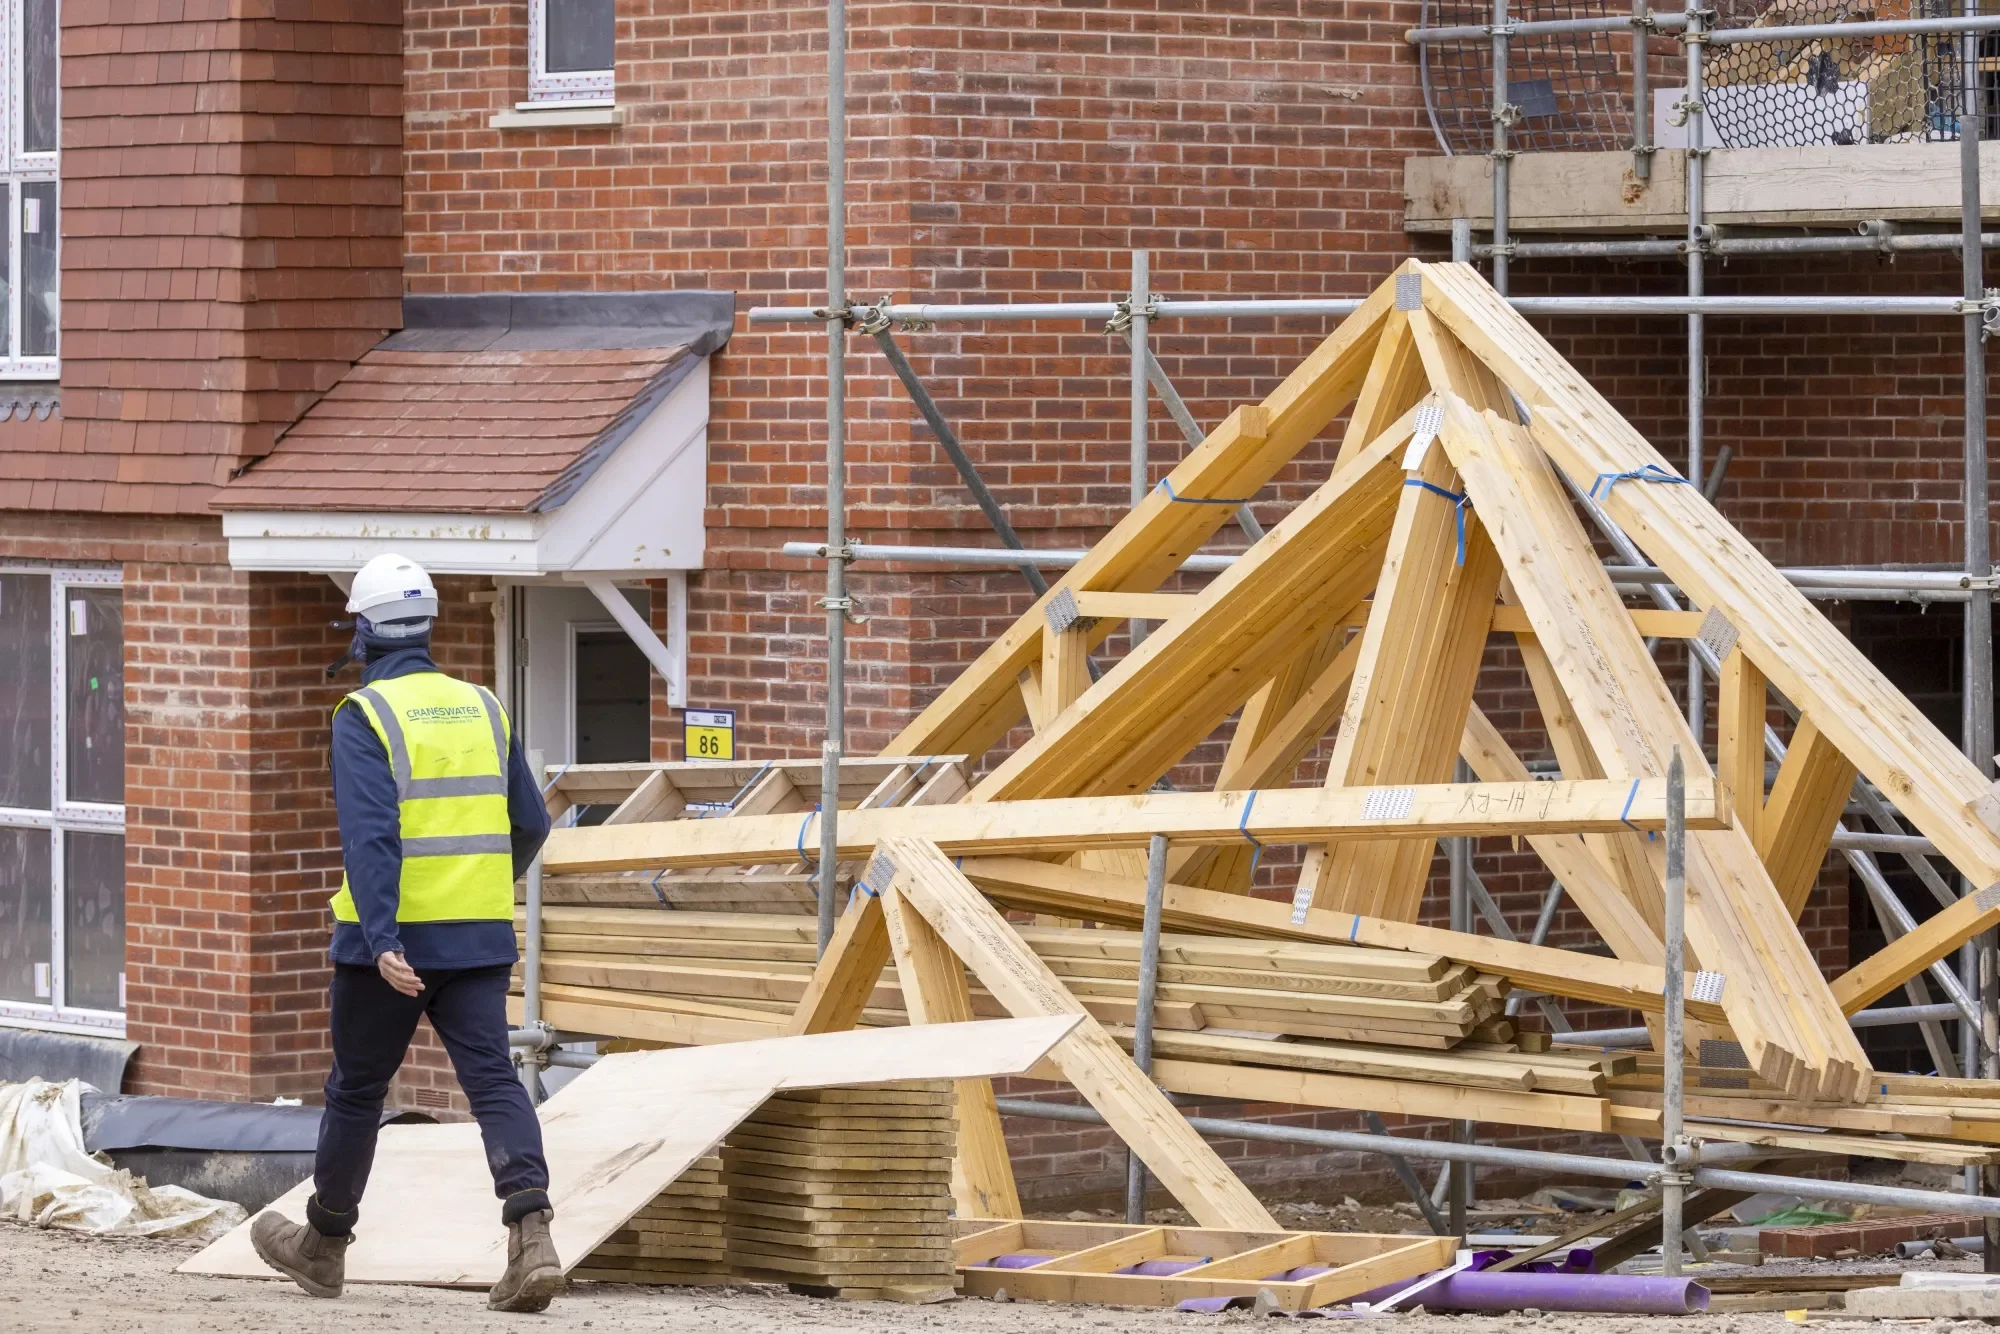
Planning reform helps at the margins. But no amount of faster approvals fixes a scheme that can't be financed at the point of development. That's the viability trap – and it's why, as Savills notes, even the most optimistic delivery scenario still leaves England well below target through the end of the decade.
"The build cost picture is the piece that gets overlooked. Costs are up significantly, and that eats directly into development viability. Even well-located, consented sites aren't always getting built because the numbers no longer work the way they did two or three years ago. It's an additional constraint sitting on top of the planning issues – and together, they make it very hard for supply to respond to demand at the pace the market needs."
— John Treacy, Director and Co-Founder of On Invest
The Rental Sector Is Being Squeezed From Both Ends
While new supply stalls, the pressure on the existing rental market has been intensifying from two directions simultaneously – and the data on both is striking.
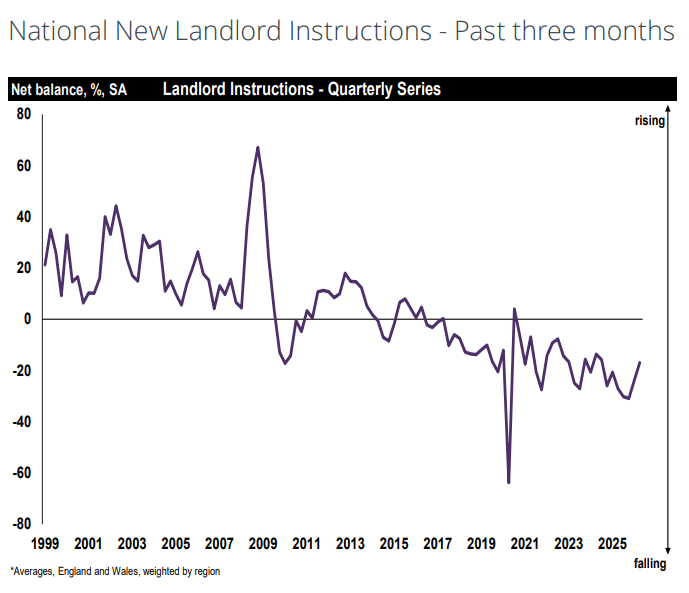
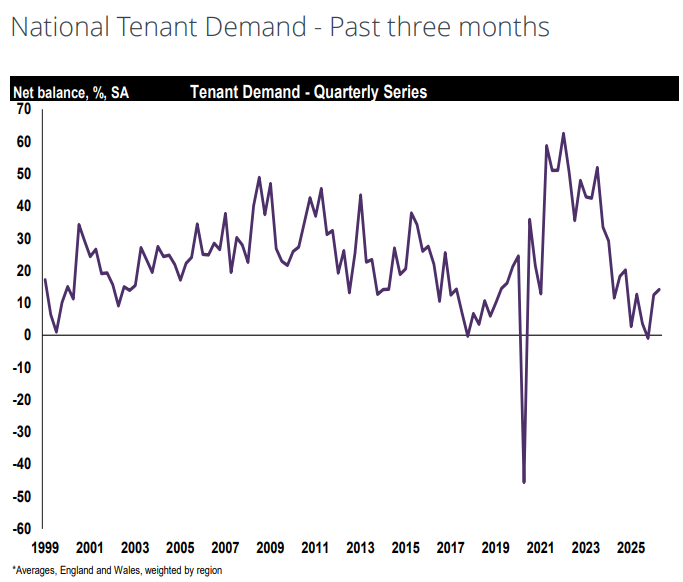
On the private landlord side, RICS's April 2026 survey found tenant demand rising at a net balance of +14%, while landlord instructions remained deeply negative at -17%. The Royal Institution of Chartered Surveyors has reported demand outstripping supply in the lettings market consistently for the better part of three years.
Source: RICS UK Residential Market Survey, April 2026.
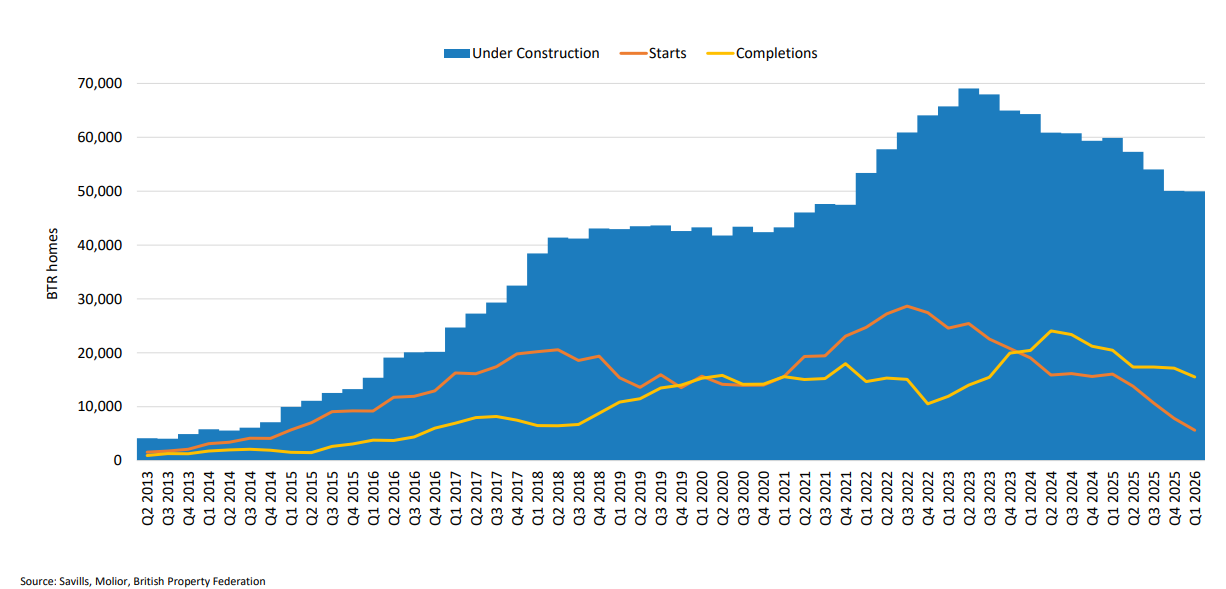
On the institutional side, the picture is more nuanced – but no less significant. Build-to-rent completions have been strong, with the British Property Federation recording over 147,000 homes delivered to date, up 12% year on year. The problem lies further back in the pipeline. New BTR fell 65% in the year to Q1 2026, dropping from over 16,000 to just 5,619 – and completions have outpaced new starts for nine consecutive quarters. What's being delivered now was committed to years ago. The future pipeline is thinning out, and that gap will show up in the market within the next two to three years.
Source: Savills Research, MHCLG (Table 1011), British Property Federation, Molior, Glenigan, Scottish Government, StatsWales
The result is a rental market where near-term completions are holding up, but the medium-term supply picture is getting tighter — precisely when tenant demand shows no sign of softening.
Where Structural Shortage Creates the Clearest Opportunity
A national deficit doesn't hit evenly. It concentrates most acutely where the gap between what's being built and what's needed is widest – and where demographic and economic demand is strongest.
The latest UK House Price Index data shows house prices growing fastest in the North West and declining in London – a regional rotation that reflects where employment growth, population movement, and infrastructure investment are now concentrated. Birmingham and Manchester sit at the centre of that shift, absorbing demand at a rate that the development pipeline cannot match.
Price change by region for England
| Region | Average price April 2026 |
Annual change % since April 2025 |
Monthly change % since March 2026 |
|---|---|---|---|
| East Midlands | £242,000 | 5.5 | 0.0 |
| East of England | £336,000 | 3.8 | 0.3 |
| London | £553,000 | -2.1 | 1.9 |
| North East | £163,000 | 9.9 | 0.7 |
| North West | £216,000 | 7.2 | 0.6 |
| South East | £377,000 | 0.3 | -0.3 |
| South West | £303,000 | 3.5 | 0.3 |
| West Midlands | £251,000 | 5.8 | 1.8 |
| Yorkshire and the Humber | £208,000 | 7.2 | 0.3 |
Source: ONS House Price Index, England, April 2026
For investors, the combination of constrained supply, structural rental demand, and regional price momentum creates a fundamentally different environment from chasing yield in markets where supply is more elastic. The shortage isn't speculative – it's documented across multiple independent data sources, and it's been consistent enough that the Centre for Cities describes it as a half-century problem, not a five-year one.
What This Means If You're Positioning Capital Now
The question we hear most often from expats across Asia and the Middle East is some version of: "Why now?" The evidence above is part of the answer. When the structural deficit is measured in millions rather than thousands of homes, when rental demand is rising while supply shrinks from both private and institutional sources, and when the recovery in planning – however real – is still 18 or more months away from translating into completed homes, the case for waiting for a better entry point becomes increasingly difficult to make.

On Invest's focus on city-centre Birmingham and Manchester is built on exactly this backdrop – markets where the data is most compelling, the employment fundamentals are strongest, and the supply picture is least likely to change on any meaningful investment horizon.
If you want to talk through what this means for your own investment decisions – whether you're considering your first UK acquisition or looking at where to place additional capital – reach out to our team. We work with clients across Asia and the Middle East, and we'll walk you through current availability, expected yields, and our approach to risk and positioning in both cities right now.